Airline networks change slowly in good times, and very quickly in bad times. One of the clearest patterns in schedule data is how airlines rebalance capacity when uncertainty hits.
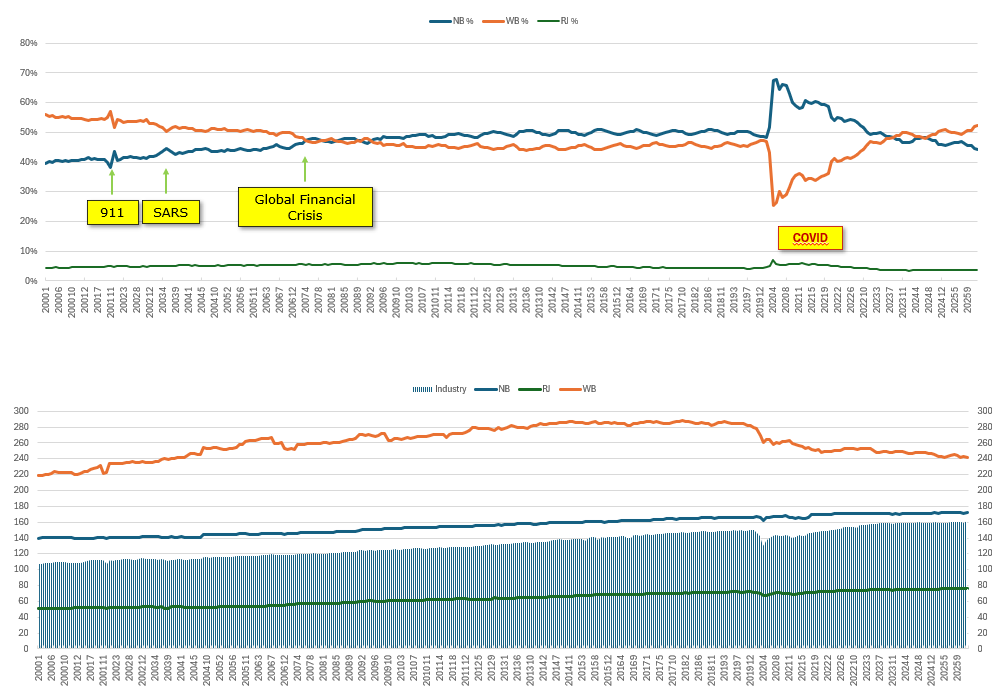
Using Sabre Market Intelligence schedule data, the story is consistent across major disruptions. After 9/11, SARS, the Global Financial Crisis, and COVID, airlines reduce WB capacity more aggressively than NB capacity. As a result, the share of ASM flown by NB aircraft rises during downturns, while WB share falls.
This is not just a temporary shock response. Since the Global Financial Crisis period, NB capacity has exceeded WB capacity on an ASM basis, and that structural shift has persisted.
Source: Sabre Market Intelligence (published schedules).
Why wide-bodies are cut first
Wide-body flying concentrates exposure. Long-haul networks depend on cross-border access, stable demand, and a healthy premium segment. When conditions deteriorate, those assumptions weaken at the same time.
Wide-bodies also have fewer redeployment options. A narrow-body can be moved across domestic and regional markets, adjusted through frequency, and matched to demand with relatively fine control. A wide-body is typically tied to fewer routes, longer cycles, and more binary scheduling decisions.
So when airlines need to reduce risk fast, WB capacity is often the first and deepest cut. The charts show this clearly, with the most dramatic shift occurring during COVID, when WB share drops sharply while NB share rises.
The post-2007 narrow-body era
The charts also highlight a longer-run trend. After the 2007–2009 period, NB capacity becomes the larger share of total ASM and remains that way. Even as international markets recovered after COVID, the mix did not return to the earlier wide-body heavy structure.
This is consistent with two broader forces.
First, airlines have leaned into network flexibility and frequency-based economics that are easier to execute with narrow-bodies.
Second, larger and longer-range narrow-bodies have expanded the mission set that can be served without wide-body lift on many routes.
Upgauging is happening almost everywhere
The capacity mix is only half the story. The second chart shows that aircraft gauge has increased meaningfully across categories.
Narrow-body aircraft are getting larger. Average NB seats rise from about 140 in 2000 to about 172 in 2025. This is a steady, structural upgauge.
Regional aircraft are getting larger too. Average RJ seats increase from about 50 to about 76 over the same period, reflecting the long retreat from 50-seat economics and the migration toward larger regional lift.
Wide-body gauge is more cyclical. Average WB seats rise from about 220 in 2000 to about 286 in 2014–2019, then decline to about 240 in 2025. The pre-2019 period reflects larger long-haul gauge and dense trunk international deployment. The post-2019 decline suggests a shift toward more flexible wide-body deployment and a different long-haul demand environment.
Across the whole industry, the trend is up. Average seats per departure increase from about 107 in 2000 to about 161 in 2025.
What this implies for fleets and markets
A practical way to read these patterns is to focus on flexibility and risk.
In downturns, airlines protect capacity that can be adjusted incrementally and redeployed broadly. That tends to favor NB flying.
In expansions, airlines add wide-body capacity, but the long-run mix still appears more narrow-body oriented than it was two decades ago.
At the same time, upgauging changes what “core narrow-body” means. The average narrow-body today is materially larger than it was in 2000, and the average regional aircraft is also larger. This affects everything from airport gate planning to route economics to the definition of a “right-sized” fleet.
A simple way to think about it
If you remember one takeaway, it is this. Wide-body capacity behaves like the swing component of the network during crises, while narrow-body capacity behaves like the resilient core. Over time, the resilient core has also been getting bigger.
InfoJets note: At InfoJets, we use schedule data and market evidence to connect network shifts, aircraft gauge, and cycle dynamics to valuation, financing, and transaction decisions. If you are evaluating fleet exposure, lease terms, or residual risk across aircraft categories, we are happy to help you frame what the market is signaling.
